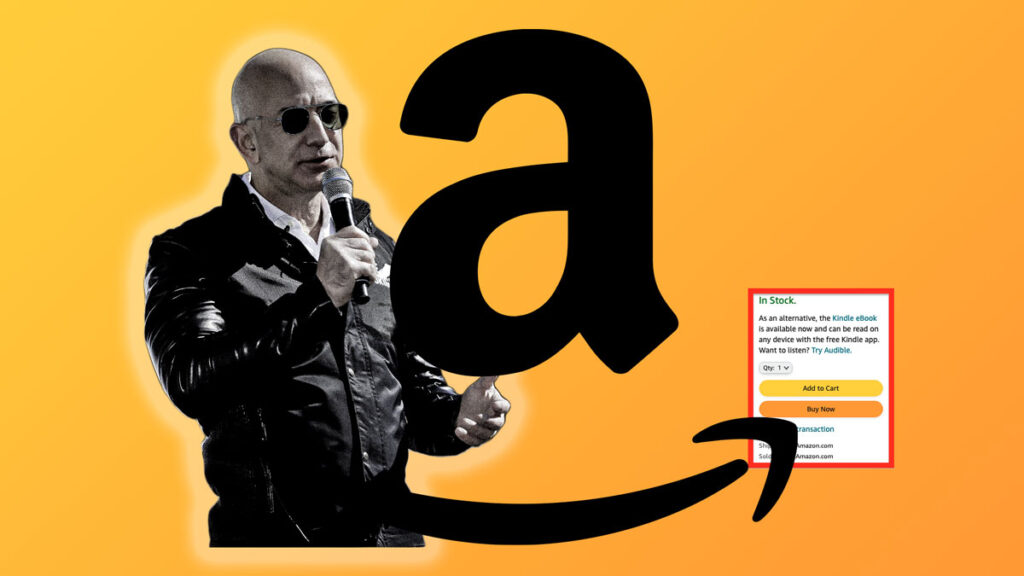
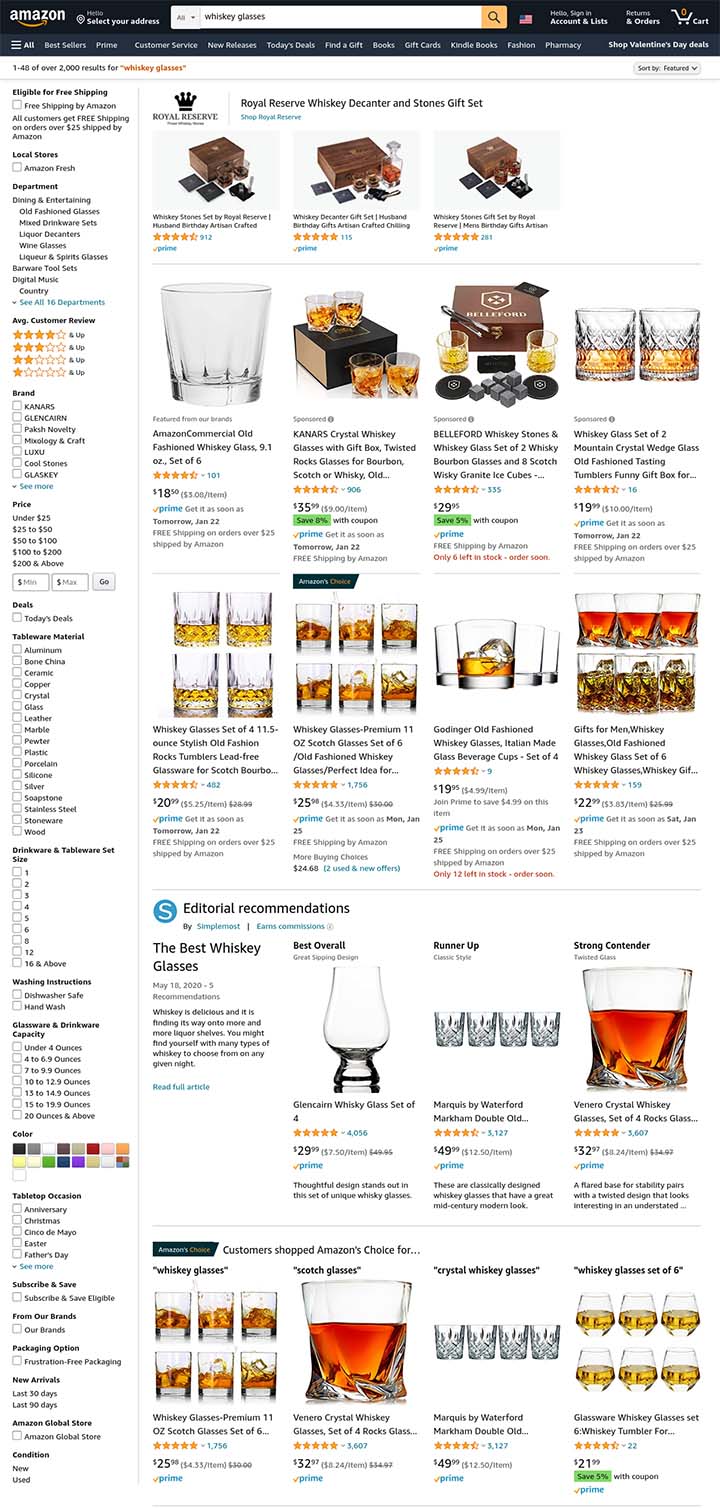
A browser extension that reveals Amazon brand and exclusive products while you shop on the site
Amazon has registered more than 150 private-label brands with the U.S. Patent and Trademark Office and carries hundreds of thousands of items from these house brands on its site.
A recent investigation by The Markup found that the online shopping behemoth often gives its own brands and exclusive products a leg up in search results over better-rated competitors. We also found Amazon is inconsistent in disclosing to shoppers that those products are Amazon-brand products or exclusives.
Few respondents in a 1,000-person national survey we commissioned recognized the best-selling Amazon brands as owned by the company, apart from Amazon Basics.
So we decided to add some transparency for Amazon shoppers. The Markup created a browser extension that identifies these products and makes their affiliation to Amazon clear.
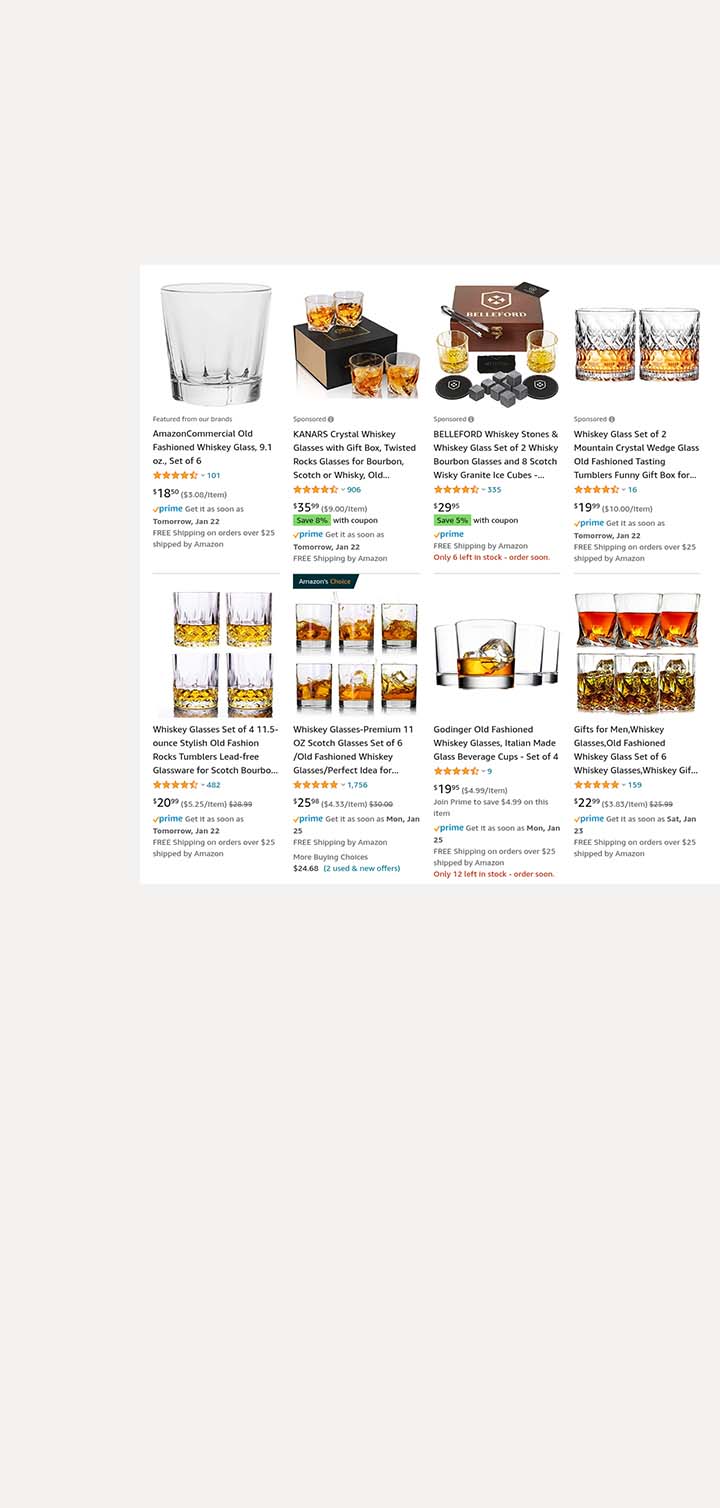
Brand Detector highlights product listings of Amazon brands and exclusive products by placing a box around them in Amazon’s signature orange. This happens live while shoppers browse the website.
The selective staining is inspired by a lab technique in biology called an assay, which we also applied to web pages in a past investigation about Google. That investigation revealed that the tech giant’s search engine gave Google properties 41 percent of real estate on the first page of popular searches.
How Does It Work?
The browser extension uses various techniques developed and refined during our year-long investigation to identify Amazon brands and exclusive products (read more in our methodology).This includes checking a list of proprietary products we created and cross-referencing Amazon’s “our brands” filter. The extension is available for Chrome (and other chromium-based browsers) and Firefox browsers.
The extension sits in the background until the user visits Amazon’s portal in the United States (amazon.com), Australia (amazon.com.au), Canada (amazon.ca), Germany (amazon.de), India (amazon.in), Italy (amazon.it), Japan (amazon.co.jp), Mexico (amazon.com.mx), Spain (amazon.es), or the United Kingdom (amazon.co.uk) and searches for something. At that point, Brand Detector identifies Amazon brands and exclusives and highlights them on the search results page. (It does not extend the product page.)
Because the “our brands” filter is not comprehensive, the extension also cross-references products against a list of proprietary electronics we found from Amazon’s best sellers section (which Amazon doesn’t include in the “our brands” filter) and performs partial text matching for phrases like “Amazon brand” and “Featured from our brands” and full text-matching for “AmazonBasics” and a few other brand names that didn’t tend to return false positives in our tests.
Even with these techniques, the extension may still miss some Amazon brand or exclusive products from time to time.
Amazon Brand Detector does not collect any data, in keeping with The Markup’s privacy policy. We won’t know how you used it, if at all, what you searched for or what you end up buying.
The extension only works on desktop browsers, not mobile apps.
Cross-Extension Compatibility
The extension can work in conjunction with other extensions, such as Fakespot, which affixes a letter grade to any Amazon product based on the authenticity of reviews for that product. Users can use these extensions together to find Amazon brands and exclusive products and their Fakespot grades.
The extension also works with full-page screenshot extensions, like “Awesome Screenshot & Screen Recorder.” You can use these to capture an entire search page stained by the extension.
The Markup is not affiliated with these extensions, nor do we endorse them.
Try It Out:
Enhance your Amazon shopping by knowing which products are from Amazon’s own brands and exclusives.
Governments increasingly use algorithms to do everything from assign benefits to dole out punishment—but attempts to regulate them have been unsuccessful
In 2018, the New York City Council created a task force to study the city’s use of automated decision systems (ADS). The concern: Algorithms, not just in New York but around the country, were increasingly being employed by government agencies to do everything from informing criminal sentencing and detecting unemployment fraud to prioritizing child abuse cases and distributing health benefits. And lawmakers, let alone the people governed by the automated decisions, knew little about how the calculations were being made.
Rare glimpses into how these algorithms were performing were not comforting: In several states, algorithms used to determine how much help residents will receive from home health aides have automatically cut benefits for thousands. Police departments across the country use the PredPol software to predict where future crimes will occur, but the program disproportionately sends police to Black and Hispanic neighborhoods. And in Michigan, an algorithm designed to detect fraudulent unemployment claims famously improperly flagged thousands of applicants, forcing residents who should have received assistance to lose their homes and file for bankruptcy.
New York City’s was the first legislation in the country aimed at shedding light on how government agencies use artificial intelligence to make decisions about people and policies.
At the time, the creation of the task force was heralded as a “watershed” moment that would usher in a new era of oversight. And indeed, in the four years since, a steady stream of reporting about the harms caused by high-stakes algorithms has prompted lawmakers across the country to introduce nearly 40 bills designed to study or regulate government agencies’ use of ADS, according to The Markup’s review of state legislation.
The bills range from proposals to create study groups to requiring agencies to audit algorithms for bias before purchasing systems from vendors. But the dozens of reforms proposed have shared a common fate: They have largely either died immediately upon introduction or expired in committees after brief hearings, according to The Markup’s review.
In New York City, that initial working group took two years to make a set of broad, nonbinding recommendations for further research and oversight. One task force member described the endeavor as a “waste.” The group could not even agree on a definition for automated decision systems, and several of its members, at the time and since, have said they did not believe city agencies and officials had bought into the process.
Elsewhere, nearly all proposals to study or regulate algorithms have failed to pass. Bills to create study groups to examine the use of algorithms failed in Massachusetts, New York state, California, Hawaii, and Virginia. Bills requiring audits of algorithms or prohibiting algorithmic discrimination have died in California, Maryland, New Jersey, and Washington state. In several cases—California, New Jersey, Massachusetts, Michigan, and Vermont—ADS oversight or study bills remain pending in the legislature, but their prospects this session are slim, according to sponsors and advocates in those states.
The only state bill to pass so far, Vermont’s, created a task force whose recommendations—to form a permanent AI commission and adopt regulations—have so far been ignored, state representative Brian Cina told The Markup.
The Markup interviewed lawmakers and lobbyists and reviewed written and oral testimony on dozens of ADS bills to examine why legislatures have failed to regulate these tools.
We found two key through lines: Lawmakers and the public lack fundamental access to information about what algorithms their agencies are using, how they’re designed, and how significantly they influence decisions. In many of the states The Markup examined, lawmakers and activists said state agencies had rebuffed their attempts to gather basic information, such as the names of tools being used.
Meanwhile, Big Tech and government contractors have successfully derailed legislation by arguing that proposals are too broad—in some cases claiming they would prevent public officials from using calculators and spreadsheets—and that requiring agencies to examine whether an ADS system is discriminatory would kill innovation and increase the price of government procurement.
Lawmakers Struggled to Figure Out What Algorithms Were Even in Use
One of the biggest challenges lawmakers have faced when seeking to regulate ADS tools is simply knowing what they are and what they do.
Following its task force’s landmark report, New York City conducted a subsequent survey of city agencies. It resulted in a list of only 16 automated decision systems across nine agencies, which members of the task force told The Markup they suspect is a severe underestimation.
“We don’t actually know where government entities or businesses use these systems, so it’s hard to make [regulations] more concrete,” said Julia Stoyanovich, a New York University computer science professor and task force member.
In 2018, Vermont became the first state to create its own ADS study group. At the conclusion of its work in 2020, the group reported that “there are examples of where state and local governments have used artificial intelligence applications, but in general the Task Force has not identified many of these applications.”
“Just because nothing popped up in a few weeks of testimony doesn’t mean that they don’t exist,” said Cina. “It’s not like we asked every single state agency to look at every single thing they use.”
In February, he introduced a bill that would have required the state to develop basic standards for agency use of ADS systems. It has sat in committee without a hearing since then.
In 2019, the Hawaii Senate passed a resolution requesting that the state convene a task force to study agency use of artificial intelligence systems, but the resolution was nonbinding and no task force convened, according to the Hawaii Legislative Reference Bureau. Legislators tried to pass a binding resolution again the next year, but it failed.
Legislators and advocacy groups who authored ADS bills in California, Maryland, Massachusetts, Michigan, New York, and Washington told The Markup that they have no clear understanding of the extent to which their state agencies use ADS tools.
Advocacy groups like the Electronic Privacy Information Center (EPIC) that have attempted to survey government agencies regarding their use of ADS systems say they routinely receive incomplete information.
“The results we’re getting are straight-up non-responses or truly pulling teeth about every little thing,” said Ben Winters, who leads EPIC’s AI and Human Rights Project.
In Washington, after an ADS regulation bill failed in 2020, the legislature created a study group tasked with making recommendations for future legislation. The ACLU of Washington proposed that the group should survey state agencies to gather more information about the tools they were using, but the study group rejected the idea, according to public minutes from the group’s meetings.
“We thought it was a simple ask,” said Jennifer Lee, the technology and liberty project manager for the ACLU of Washington. “One of the barriers we kept getting when talking to lawmakers about regulating ADS is they didn’t have an understanding of how prevalent the issue was. They kept asking, ‘What kind of systems are being used across Washington state?’ ”
Ben Winters, who leads EPIC’s AI and Human Rights Project
Lawmakers Say Corporate Influence a Hurdle
Washington’s most recent bill has stalled in committee, but an updated version will likely be reintroduced this year now that the study group has completed its final report, said state senator Bob Hasegawa, the bill’s sponsor
The legislation would have required any state agency seeking to implement an ADS system to produce an algorithmic accountability report disclosing the name and purpose of the system, what data it would use, and whether the system had been independently tested for biases, among other requirements.
The bill would also have banned the use of ADS tools that are discriminatory and required that anyone affected by an algorithmic decision be notified and have a right to appeal that decision.
“The big obstacle is corporate influence in our governmental processes,” said Hasegawa. “Washington is a pretty high-tech state and so corporate high tech has a lot of influence in our systems here. That’s where most of the pushback has been coming from because the impacted communities are pretty much unanimous that this needs to be fixed.”
California’s bill, which is similar, is still pending in committee. It encourages, but does not require, vendors seeking to sell ADS tools to government agencies to submit an ADS impact report along with their bid, which would include similar disclosures to those required by Washington’s bill.
It would also require the state’s Department of Technology to post the impact reports for active systems on its website.
Led by the California Chamber of Commerce, 26 industry groups—from big tech representatives like the Internet Association and TechNet to organizations representing banks, insurance companies, and medical device makers—signed on to a letter opposing the bill.
“There are a lot of business interests here, and they have the ears of a lot of legislators,” said Vinhcent Le, legal counsel at the nonprofit Greenlining Institute, who helped author the bill.
Originally, the Greenlining Institute and other supporters sought to regulate ADS in the private sector as well as the public but quickly encountered pushback.
“When we narrowed it to just government AI systems we thought it would make it easier,” Le said. “The argument [from industry] switched to ‘This is going to cost California taxpayers millions more.’ That cost angle, that innovation angle, that anti-business angle is something that legislators are concerned about.”
The California Chamber of Commerce declined an interview request for this story but provided a copy of the letter signed by dozens of industry groups opposing the bill. The letter states that the bill would “discourage participation in the state procurement process” because the bill encourages vendors to complete an impact assessment for their tools. The letter said the suggestion, which is not a requirement, was too burdensome. The chamber also argued that the bill’s definition of automated decision systems was too broad.
Industry lobbyists have repeatedly criticized legislation in recent years for overly broad definitions of automated decision systems despite the fact that the definitions mirror those used in internationally recognized AI ethics frameworks, regulations in Canada, and proposed regulations in the European Union.
During a committee hearing on Washington’s bill, James McMahan, policy director for the Washington Association of Sheriffs and Police Chiefs, told legislators he believed the bill would apply to “most if not all” of the state crime lab’s operations, including DNA, fingerprint, and firearm analysis.
Internet Association lobbyist Vicki Christophersen, testifying at the same hearing, suggested that the bill would prohibit the use of red light cameras. The Internet Association did not respond to an interview request.
“It’s a funny talking point,” Le said. “We actually had to put in language to say this doesn’t include a calculator or spreadsheet.”
Maryland’s bill, which died in committee, would also have required agencies to produce reports detailing the basic purpose and functions of ADS tools and would have prohibited the use of discriminatory systems.
“We’re not telling you you can’t do it [use ADS],” said Delegate Terri Hill, who sponsored the Maryland bill. “We’re just saying identify what your biases are up front and identify if they’re consistent with the state’s overarching goals and with this purpose.”
The Maryland Tech Council, an industry group representing small and large technology firms in the state, opposed the bill, arguing that the prohibitions against discrimination were premature and would hurt innovation in the state, according to written and oral testimony the group provided.
“The ability to adequately evaluate whether or not there is bias is an emerging area, and we would say that, on behalf of the tech council, putting in place this at this time is jumping ahead of where we are,” Pam Kasemeyer, the council’s lobbyist, said during a March committee hearing on the bill. “It almost stops the desire for companies to continue to try to develop and refine these out of fear that they’re going to be viewed as discriminatory.”
Limited Success in the Private Sector
There have been fewer attempts by state and local legislatures to regulate private companies’ use of ADS systems—such as those The Markup has exposed in the tenant screening and car insurance industries—but in recent years, those measures have been marginally more successful.
The New York City Council passed a bill that would require private companies to conduct bias audits of algorithmic hiring tools before using them. The tools are used by many employers to screen job candidates without the use of a human interviewer.
Illinois also enacted a state law in 2019 that requires private employers to notify job candidates when they’re being evaluated by algorithmic hiring tools. And in 2021, the legislature amended the law to require employers who use such tools to report demographic data about job candidates to a state agency to be analyzed for evidence of biased decisions.
This year the Colorado legislature also passed a law, which will take effect in 2023, that will create a framework for evaluating insurance underwriting algorithms and ban the use of discriminatory algorithms in the industry.
CEO Mark Zuckerberg had repeatedly promised to stop recommending political groups to users to squelch the spread of misinformation
Leaked internal Facebook documents show that a combination of technical miscommunications and high-level decisions led to one of the social media giant’s biggest broken promises of the 2020 election—that it would stop recommending political groups to users.
The Markup first revealed on Jan. 19 that Facebook was continuing to recommend political groups—including some in which users advocated violence and storming the U.S. Capitol—in spite of multiple promises not to do so, including one made under oath to Congress.
The day the article ran, a Facebook team started investigating the “leakage,” according to documents provided by Frances Haugen to Congress and shared with The Markup, and the problem was escalated to the highest level to be “reviewed by Mark.” Over the course of the next week, Facebook employees identified several causes for the broken promise.
The company, according to work log entries in the leaked documents, was updating its list of designated political groups, which it refers to as civic groups, in real time. But the systems that recommend groups to users were cached on servers and users’ devices and only updated every 24 to 48 hours in some cases. The lag resulted in users receiving recommendations for groups that had recently been designated political, according to the logs.
That technical oversight was compounded by a decision Facebook officials made about how to determine whether or not a particular group was political in nature.
When The Markup examined group recommendations using data from our Citizen Browser project—a paid, nationwide panel of Facebook users who automatically supply us data from their Facebook feeds—we designated groups as political or not based on their names, about pages, rules, and posted content. We found 12 political groups among the top 100 groups most frequently recommended to our panelists.
Facebook chose to define groups as political in a different way—by looking at the last seven days’ worth of content in a given group.
“Civic filter uses last 7 day content that is created/viewed in the group to determine if the group is civic or not,” according to a summary of the problem written by a Facebook employee working to solve the issue.
As a result, the company was seeing a “12% churn” in its list of groups designated as political. If a group went seven days without posting content the company’s algorithms deemed political, it would be taken off the blacklist and could once again be recommended to users.
Almost 90 percent of the impressions—the number of times a recommendation was seen—on political groups that Facebook tallied while trying to solve the recommendation problem were a result of the day-to-day turnover on the civic group blacklist, according to the documents.
Facebook did not directly respond to questions for this story.
“We learned that some civic groups were recommended to users, and we looked into it,” Facebook spokesperson Leonard Lam wrote in an email to The Markup. “The issue stemmed from the filtering process after designation that allowed some Groups to remain in the recommendation pool and be visible to a small number of people when they should not have been. Since becoming aware of the issue, we worked quickly to update our processes, and we continue this work to improve our designation and filtering processes to make them as accurate and effective as possible.”
Social networking and misinformation researchers say that the company’s decision to classify groups as political based on seven days’ worth of content was always likely to fall short.
“They’re definitely going to be missing signals with that because groups are extremely dynamic,” said Jane Lytvynenko, a research fellow at the Harvard Shorenstein Center’s Technology and Social Change Project. “Looking at the last seven days, rather than groups as a whole and the stated intent of groups, is going to give you different results. It seems like maybe what they were trying to do is not cast too wide of a net with political groups.”
Many of the groups Facebook recommended to Citizen Browser users had overtly political names.
More than 19 percent of Citizen Browser panelists who voted for Donald Trump received recommendations for a group called Candace Owens for POTUS, 2024, for example. While Joe Biden voters were less likely to be nudged toward political groups, some received recommendations for groups like Lincoln Project Americans Protecting Democracy.
The internal Facebook investigation into the political recommendations confirmed these problems. By Jan. 25, six days after The Markup’s original article, a Facebook employee declared that the problem was “mitigated,” although root causes were still under investigation.
On Feb. 10, Facebook blamed the problem on “technical issues” in a letter it sent to U.S. senator Ed Markey, who had demanded an explanation.
In the early days after the company’s internal investigation, the issue appeared to have been resolved. Both Citizen Browser and Facebook’s internal data showed that recommendations for political groups had virtually disappeared.
But when The Markup reexamined Facebook’s recommendations in June, we discovered that the platform was once again nudging Citizen Browser users toward political groups, including some in which members explicitly advocated violence.
From February to June, just under one-third of Citizen Browser’s 2,315 panelists received recommendations to join a political group. That included groups with names like Progressive Democrats of Nevada, Michigan Republicans, Liberty lovers for Ted Cruz, and Bernie Sanders for President, 2020.
Facebook insists that mainstream news sites perform the best on its platform. But by other measures, sensationalist, partisan content reigns
In early November, Facebook published its Q3 Widely Viewed Content Report, the second in a series meant to rebut critics who said that its algorithms were boosting extremist and sensational content. The report declared that, among other things, the most popular informational content on Facebook came from sources like UNICEF, ABC News, or the CDC.
But data collected by The Markup suggests that, on the contrary, sensationalist news or viral content with little original reporting performs just as well as—and often better than—many mainstream sources when it comes to how often it’s seen by platform users.
Data from The Markup’s Citizen Browser project shows that during the period from July 1 to Sept. 30, 2021, outlets like The Daily Wire, The Western Journal, and BuzzFeed’s viral content arm were among the top-viewed domains in our sample.
Citizen Browser is a national panel of paid Facebook users who automatically share their news feed data with The Markup.
To analyze the websites whose content performs the best on Facebook, we counted the total number of times that links from any domain appeared in our panelists’ news feeds—a metric known as “impressions”—over a three-month period (the same time covered by Facebook’s Q3 Widely Viewed Content Report). Facebook, by contrast, chose a different metric, calculating the “most-viewed” domains by tallying only the number of users who saw links, regardless of whether each user saw a link once or hundreds of times.
By our calculation, the top performing domains were those that surfaced in users’ feeds over and over—including some highly partisan, polarizing sites that effectively bombarded some Facebook users with content.
These findings chime with recent revelations from Facebook whistleblower Frances Haugen, who has repeatedly said the company has a tendency to cherry-pick statistics to release to the press and the public.
When presented with The Markup’s findings and asked whether its own report’s statistics might be misleading or incomplete, Ariana Anthony, a spokesperson for Meta, Facebook’s parent company, said in an emailed statement, “The focus of the Widely Viewed Content Report is to show the content that is seen by the most people on Facebook, not the content that is posted most frequently. That said, we will continue to refine and improve these reports as we engage with academics, civil society groups, and researchers to identify the parts of these reports they find most valuable, which metrics need more context, and how we can best support greater understanding of content distribution on Facebook moving forward.”
Anthony did not directly respond to questions from The Markup on whether the company would release data on the total number of link views or the content that was seen most frequently on the platform.
The Battle Over Data
There are many ways to measure popularity on Facebook, and each tells a different story about the platform and what kind of content its algorithms favor.
For years, the startup CrowdTangle’s “engagement” metric—essentially measuring a combination of how many likes, comments, and other interactions any domain’s posts garner—has been the most publicly visible way of measuring popularity. Facebook bought CrowdTangle in 2016 and, according to reporting in The New York Times, has since largely tried to downplay data showing that ultra-conservative commentators like The Daily Wire’s Ben Shapiro produce the most engaged-with content on the platform.
Shortly after the end of the second quarter of this year, Facebook came out with its first transparency report, framed in the introduction as a way to “provide clarity” on “the most-viewed domains, links, Pages and posts on the platform during the quarter.” (More accurately, the Q2 report was the first publicly released transparency report, after a Q1 report was, The New York Times reported, suppressed for making the company look bad and only released later after details emerged.)
For the Q2 and Q3 reports, Facebook turned to a specific metric, known as “reach,” to quantify most-viewed domains. For any given domain, say youtube.com or twitter.com, reach represents the number of unique Facebook accounts that had at least one post containing a link to a tweet or a YouTube video in their news feeds during the quarter. On that basis, Facebook found that those domains, and other mainstream staples like Amazon, Spotify, and TikTok, had wide reach.
When applying this metric, The Markup found similar results in our Citizen Browser data, as detailed in depth in our methodology. But this calculation ignores a reality for a lot of Facebook users: bombardment with content from the same site.
Citizen Browser data shows, for instance, that from July through September of this year, articles from far-right news site Newsmax appeared in the feed of a 58-year-old woman in New Mexico 1,065 times—but under Facebook’s calculation of reach, this would count as one single unit. Similarly, a 37-year-old man in New Hampshire was shown 245 unique links to satirical posts from The Onion, which appeared in his feed more than 500 times—but again, he would have been counted just once by Facebook’s method.
When The Markup instead counted each appearance of a domain on a user’s feed during Q3—e.g., Newsmax as 1,065 instead of 1—we found that polarizing, partisan content jumped in the performance rankings. Indeed, the same trend is true of the domains in Facebook’s Q2 report, for which analysis can be found in our data repository on GitHub.
We found that outlets like The Daily Wire, BuzzFeed’s viral content arm, Fox News, and Yahoo News jumped in the popularity rankings when we used the impressions metric. Most striking, The Western Journal—which, similarly to The Daily Wire, does little original reporting and instead repackages stories to fit with right-wing narratives—improved its ranking by almost 200 places.
“To me these findings raise a number of questions,” said Jane Lytvynenko, senior research fellow at the Harvard Kennedy School Shorenstein Center.
“Was Facebook’s research genuine, or was it part of an attempt to change the narrative around top 10 lists that were previously put out? It matters a lot whether a person sees a link one time or if they see it 20 times, and to not account for that in a report, to me, is misleading,” Lytvynenko said.
Using a narrow range of data to gauge popularity is suspect, said Alixandra Barasch, associate professor of marketing at NYU’s Stern School of Business.
“It just goes against everything we teach and know about advertising to focus on one [metric] rather than the other,” she said.
In fact, when it comes to the core business model of selling space to advertisers, Facebook encourages them to consider yet another metric, “frequency”—how many times to show a post to each user on average—when trying to optimize brand messaging.
Data from Citizen Browser shows that domains seen with high frequency in the Facebook news feed are mostly news domains, since news websites tend to publish multiple articles over the course of a day or week. But Facebook’s own content report does not take this data into account.
“[This] clarifies the point that what we need is independent access for researchers to check the math,” said Justin Hendrix, co-author of a report on social media and polarization and editor at Tech Policy Press, after reviewing The Markup’s data.
Small businesses and individuals say that in order to sell their products online in the U.S., they have to be on Amazon and—given the millions of products on its virtual shelves at any moment—they have to get a high ranking from Amazon’s product search engine or buy sponsored listings.
Amazon transitioned from digital retailer to sales platform in 2000, when it took a page from eBay and started allowing individuals and companies to sell through its website. This led to explosive sales growth (though the company reported only small profits overall, choosing to reinvest its profits for most of its existence). Amazon encouraged these “third-party sellers” with add-on services like storage, shipping, and advertising. Third-party sellers now account for 58 percent of sales on Amazon.
Even as sellers saw their revenues grow, they started to suspect that Amazon was using their nonpublic sales information to stock and sell similar products, often for less money.
Indeed, Amazon has been investing in creating products sold under its own brand names since at least 2007. Since 2017, it has dramatically expanded its catalog of private-label brands (which are trademarked by Amazon and its partners) and its list of exclusive products (developed by third-party companies who agree to sell them only on Amazon). The company refers to both as “our brands” in various parts of its website.
We found that Amazon has now registered trademarks for more than 150 private-label brands, and market research firm TJI Research estimated the number of brands developed by others but sold exclusively on Amazon.com at 598 in 2019. Some of its house brand names signal to buyers that they are part of the company—such as Amazon Basics, Amazon Essentials, and Amazon Commercial.
But hundreds of others carry labels that do not clearly indicate that they belong to the online retail giant—including Goodthreads, Lark & Ro, Austin Mill, Whole Paws, Afterthought, Truity, find., Fetch, Mr. Beams, Happy Belly, Mama Bear, Wag, Solimo, and The Portland Plaid Co.
Amazon says it sold $3 billion in private-label goods in 2019, representing just one percent of sales on the platform, but does not specify which brands are included in that estimate. Analysts with SunTrust Robinson Humphrey estimated that Amazon sold five times as much, $15.6 billion of private-label goods in 2019, including brands owned by Whole Foods, and that the figure will reach $31 billion by 2022.
The result is that sellers now not only compete against each other for placement in Amazon search results but also increasingly against Amazon’s own in-house brands and exclusives. According to a to a 2021 report by JungleScout, 50 percent of sellers say Amazon’s products directly compete with theirs.
We sought to investigate how Amazon treats its own products in search results. These are proprietary devices, private labels, and exclusive-to-Amazon brands it considers “our brands.”
To do so, we started by developing a list of 3,492 popular product searches, ran those searches on desktop (without logging in), and analyzed the first page of results.
We found that in searches that contained Amazon brand and exclusive products, the company routinely put them first, above those from competing brands with better ratings and more reviews on Amazon.
Furthermore, we trained supervised machine learning classifiers and found that being an Amazon brand or exclusive was a significantly more important factor in being selected by Amazon for the number one spot than star ratings (a proxy for quality), review quantity (a proxy for sales volume), and any of the other four factors we tested. We did not analyze the potential effect of price on ranking because unit sizes were not standard, affecting price. In addition, similar products can vary by factors that affect price, such as materials and workmanship, for which we also could not control.
Importantly, we found that knowing only whether a product was an Amazon brand or not could predict whether the product got the top spot 70 percent of the time.
In a nationally representative survey we commissioned, only 17 percent of respondents said they expect the determining factor behind whether Amazon places a product first is whether it owns the brand. About half (49 percent) said they thought the products Amazon placed in the number one spot were the best-selling, best-rated, or had the lowest price. The remaining 33 percent said they didn’t know how Amazon ranked products.
We found that Amazon disproportionately placed its own products in the top search result. Despite making up only 5.8 percent of products in our sample, Amazon gave its own products and exclusives the number one spot 19.5 percent of the time overall. By comparison, competing brands (those that are not Amazon brands or exclusive products) were given the number one spot at a nearly identical rate but comprised more than 13 times as many products at 76.9 percent.
Most of the Amazon brand and exclusive products that the company put in the number one spot, but not all—83.9 percent—were labeled “featured from our brands” and carried the phrase “sponsored result” in the source code (as well as being part of a grid labeled “search results” in the source code). They were not marked “sponsored” to shoppers.
In a short, written statement, Amazon spokesperson Nell Rona said that the company does not favor its brands in search results and that it considers “featured from our brands” listings as “merchandising placements” and not “search results,” despite their presence in the search results grid. Rona said these listings are not advertisements, and declined to answer dozens of other questions.
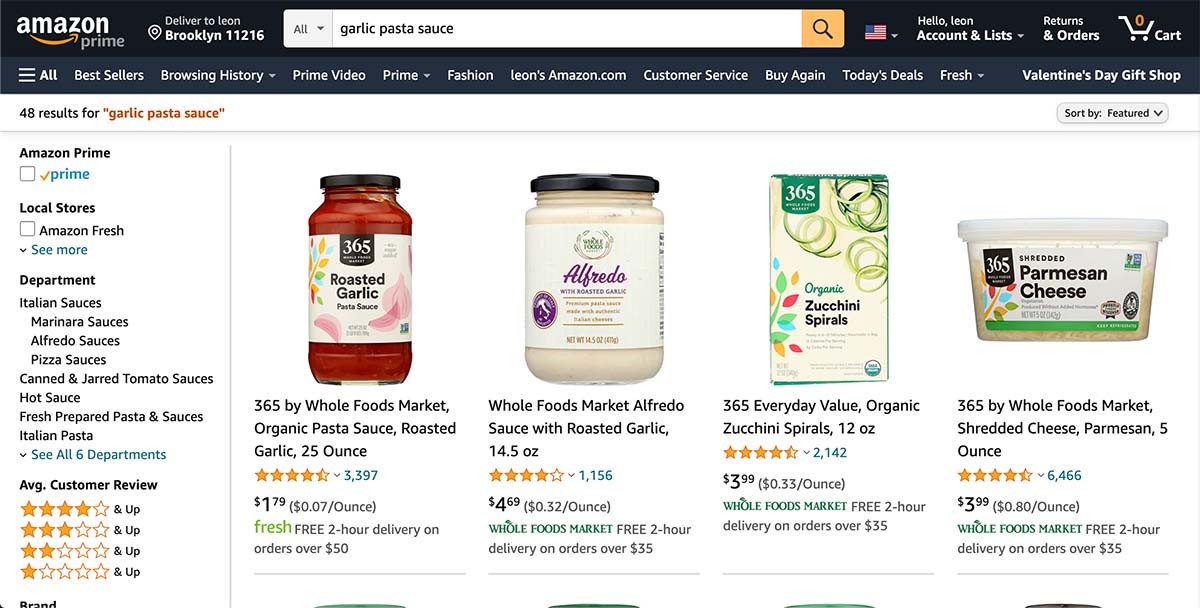
Overall, 37.4 percent of Amazon brand or exclusive products in search results in our sample were neither labeled as “our brands” nor carried a name widely associated with the company, such as AmazonBasics or Whole Foods. That left buyers unaware that they were buying an Amazon brand or exclusive-to-Amazon product.
Nearly nine-in-10 U.S. adults who responded to our survey were unable to identify Amazon’s highest-selling private label brands (Pinzon, Solimo, and Goodthreads), and only 51 percent were aware that Whole Foods is an Amazon-owned brand.
Rona said Amazon identifies its products by including the words “Amazon brand” on the products page, among a list of the item’s features, and sometimes in the listing title. We only found this to be the case in 23 percent of products in our sample that were Amazon-owned brands.
Comparing product pages three months apart, we found that they were less dynamic than they used to be. The default seller among products with multiple merchants only changed in 23.5 percent of products in our data. This was significantly less often than a comparable study from five years ago.
Background
Amazon and third-party sellers have a tense symbiosis. Amazon founder and chairman Jeff Bezos has acknowledged the importance of sellers to the company’s bottom line but also calls them competitors. Amazon provides shipping, inventory management, and other services, he wrote, that “helped independent sellers compete against our first-party business” to begin with. Sellers say Amazon’s fees cut deep into their margins but they can’t get the same volume of sales anywhere else.
Antitrust regulators in Europe, Asia, and North America have been examining Amazon’s treatment of third-party sellers.
The European Commission announced an antitrust investigation in 2019, alleging Amazon used third-party seller data to inform its own sales decisions. The commission also announced a separate investigation in 2020 into whether Amazon gives preference to its own listings and to third-party sellers that use its shipping services over other sellers. Last year, India’s antitrust regulator announced an investigation into alleged anti-competitive practices by Amazon, including preferential treatment for some sellers. And in June 2021, U.S. lawmakers introduced the American Choice and Innovation Online Act, which prohibits large platforms from advantaging themselves in their own marketplaces or using nonpublic data generated by business conducted on their platform. Authorities in Germany and Canada are investigating Amazon’s selling conditions for third-party sellers, and the attorney general for Washington, D.C., filed a lawsuit in May 2021 that accuses Amazon of overly restrictive requirements for third-party sellers.
Also last year, U.S. lawmakers pressed Bezos on his treatment of third-party sellers during a congressional hearing that was part of an antitrust investigation into the four major tech companies. Rep. Lucy McBath, a Democrat from Georgia, told Bezos, “We’ve interviewed many small businesses, and they use the words like ‘bullying,’ ‘fear,’ and ‘panic’ to describe their relationship with Amazon.” The resulting report produced by the subcommittee indicated Amazon was well aware of its power over third-party sellers, citing an internal Amazon document that “suggests the company can increase fees to third-party sellers without concern for them switching to another marketplace.”
Journalists and researchers have documented instances of Amazon promoting its house brands over competitors’. In 2016, Capitol Forum, a subscription news service focused on antitrust issues, examined hundreds of listings and found that Amazon “prioritizes its own clothing brands on the promotional carousel labeled ‘Customers Who Bought This Item Also Bought’ ” on product pages. Capitol Forum said Amazon did not respond to its request for comment.
A study titled “When the Umpire is also a Player: Bias in Private Label Product Recommendations on E-commerce Marketplaces,” presented at the Association for Computing Machinery’s Conference on Fairness, Accountability, and Transparency in March 2021, examined how Amazon’s private-label brands performed in “related products” recommendations on product pages for backpacks and batteries. The researchers said they found that “sponsored recommendations are significantly more biased toward Amazon private label products compared to organic recommendations.”
In June 2020, ProPublica reported that Amazon was reserving the top spot in search results for its own brands across dozens of search terms, labeling it “featured from our brands” and shutting others out. An Amazon spokesperson told ProPublica at the time that the move was a “normal part of retail that’s happened for decades.”
Our investigation is the first study to use thousands of search queries to test how Amazon’s house brands rank in search results—and to use machine learning classifiers to determine whether sales or quality appeared to be predictive of which products Amazon placed first in search results.
In addition, we used a multipronged approach to identify Amazon house brands and exclusives, building a data set of 137,428 unique products on Amazon, which is available in our GitHub. We were unable to find any such publicly accessible dataset when we began our investigation.
Methodology: Data Collection
Sourcing Product Search Queries
To measure how Amazon’s search engine ranked Amazon’s own products relative to competing brands, we needed a list of common queries that reflect what real people search. We built the dataset from top searches from U.S. e-commerce retailers, using two sources.
The first was autocomplete queries on Amazon.com’s and Walmart.com’s product search bars. We cycled through each letter of the alphabet (A–Z) as well as numbers ranging from 0 to 19 and saved the suggested search queries presented by the autocomplete algorithm. This process yielded 7,696 queries from Amazon.com and 3,806 queries from Walmart.com.
We then gathered the most popular searches reported by Amazon via its Seller Central hub. We collected the top 300 searches between Q1 and Q3 2020 for the Amazon categories “Softlines,” “Grocery,” “Automotive,” “Toys,” “Office Products,” “Beauty,” “Baby,” “Electronics,” and “Amazon.com.” This provided 2,700 unique searches.
Combining the autocomplete queries and seller-central queries resulted in 11,342 unique “top search” queries.
Collecting Search Results
We created a Firefox desktop emulator using Selenium. The emulator visited Amazon.com and made each of the 11,342 searches on Jan. 21, 2021. The search emulator was forwarded through IP addresses in a single location, Washington, D.C., in order to reduce variation in search results (which typically vary by location).
We saved a screenshot of the first page of search results as well as the HTML source code. (Examples of screenshots and source code for search results are available on GitHub.)
In the source code of product search result pages, Amazon titles some listings with the data field “s-search-result.” This is what we are calling search results in our data. Amazon does serve other products on the search results page in advertising and other promotional carousels, including “editorial picks” and “top rated from our brands,” but those do not appear in every result (at most a third of our sample), and they are not part of the grid that Amazon labels search results.
On desktop, the majority of Amazon-labeled “search results” in our data were delivered in uniform 60-product positions (four per column for 15 rows, though Amazon narrows the width to three columns on smaller screens). Some searches returned fewer than 60 products, but none returned more. A minority (about one in 10) of searches in our data returned 22 products or fewer, delivered in a single column, one item per row. This happened for some electronics searches but never in other search categories.
Because we were seeking to analyze how Amazon ranks its own products relative to competing brands’ products, we further limited our analysis to search results that contained Amazon brands and exclusives on the first page. Of the 11,342 top searches, slightly less than three in 10 (30.8 percent) contained this type of product on the first page. We used the resulting 3,492 top searches for our analysis.
Identifying Amazon’s Brands and Exclusives
We were unable to find a public database of Amazon brand and exclusive products, so we had to build one.
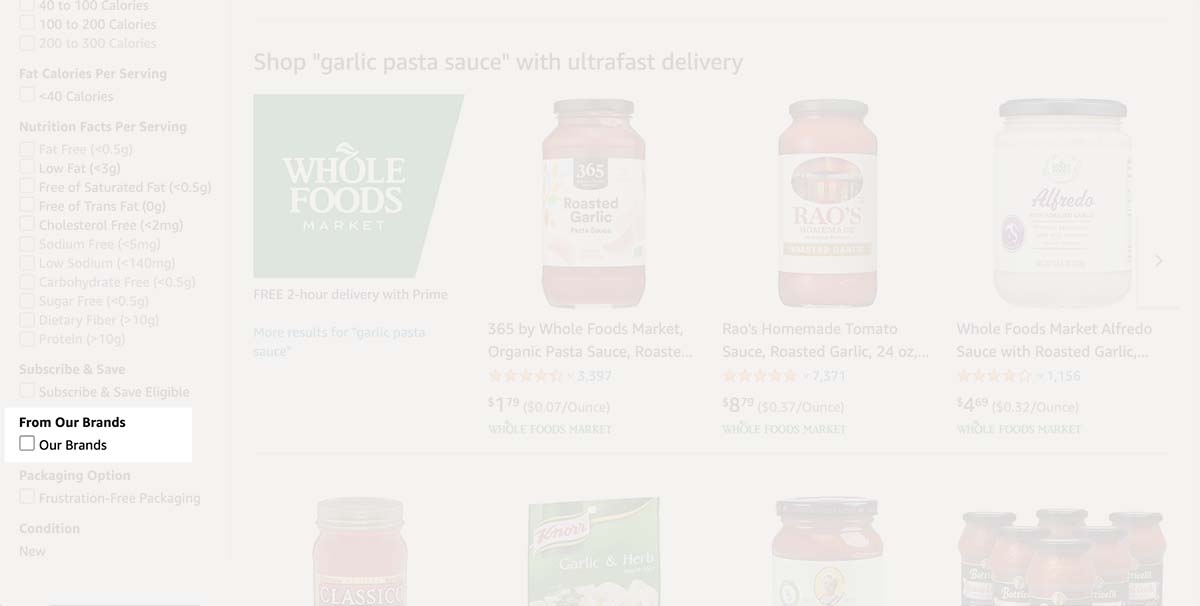
We started with the search pages themselves. On many (but not all), Amazon provides a filter on the left-hand side, allowing shoppers to limit the search to “our brands,” which Amazon says lists only its private label products and “a curated selection of brands exclusively sold on Amazon.”
We collected each of those “our brand” results for each query, saving a screenshot and the source code, also on Jan. 21, 2021.
We then discovered an undocumented API that yields all Amazon “our brands” products for any given search. We ran all 11,342 search terms through this API and saved those responses as well. (API responses are available on GitHub.)
Both the search emulator and API requests were forwarded through IP addresses in Washington, D.C.
Strangely, Amazon does not identify proprietary electronics, including Kindle readers and Ring doorbells, when a shopper filters a search result to list only Amazon’s “our brands.” To identify those, we also gathered products Amazon listed as best sellers in the category “Amazon Devices & Accessories.”
Together, all three sources yielded a dataset of 137,428 unique products, identified by their 10-character ASIN (Amazon Standard Identification Number). This dataset of Amazon’s proprietary devices, private label, and exclusive products is available on GitHub.
It is the largest and most comprehensive open access dataset of Amazon brand and Amazon-exclusive products we’ve seen, and yet we know it is not complete. Amazon told Congress in July 2019 that at that time it sold approximately 158,000 products from its own brands.
Collecting Product Pages
In addition to the above, we collected the individual product pages for the 125,769 products that appeared in the first page of our 3,492 top searches in order to analyze the buy box information. The buy box displays the price, return policy, default seller, and default shipper for a product.
To gather the product pages, we used Amazon Web Services and the same Selenium emulator we made for collecting the search result pages. The emulator visited the hyperlink for each product and saved a screenshot and the source code.
We collected these pages on Feb. 3–6 and Feb. 17–18, a few weeks after we scraped the search result pages. To determine the effects of the delay, we analyzed how often a subsample of buy boxes’ default sellers and shippers flipped between Amazon and third parties after a similar lag and found they remained largely unchanged (see more in Limitations).
Product Characteristics
We asked up to four questions of every product listing in order to identify certain characteristics and used this to produce the categories we used in our analysis.
is_sponsored: Is the listing a paid placement?
is_amazon: Is the listing for an Amazon brand or exclusive?
is_shipped_by_amazon: Does the default seller of the product (the “buy box”) use Amazon to ship the listed product?
is_sold_by_amazon: Is the default seller of the product Amazon?
Sponsored products (is_sponsored) are the most straightforward: Amazon labels them “sponsored.” If a product in the Amazon-labeled search results is not sponsored, we consider it “organic.” We only identified products with subsequent features if they were organic.
We identified an organic product as an Amazon brand or exclusive (is_amazon) when it matched one of the 137,428 Amazon ASINs we collected. If it didn’t match, we considered it a “competing brand.”
We identified a product as is_amazon_sold if the “sold by” text in the buy box contained “Amazon,” “Whole Foods,” or “Zappos” (which is owned by Amazon). If it didn’t, we identified the product as “Third-Party Sold.”
We identified a product as is_amazon_shipped if the buy box shipper information contained “Amazon” (including “Amazon Prime,” “Amazon Fresh,” and “Fulfilled by Amazon”), “Whole Foods,” or “Zappos” (which is owned by Amazon). If it didn’t contain Amazon, we identified products as “Third-Party Shipped.”
We use these features to train and evaluate predictive classifiers (see Random Forest Analysis) as well as produce product categories in our ranking analysis (see the following section).
Most of the categories have a direct relationship with the features they are named after.
We categorized products as “Sponsored” if we identified them as is_sponsored. Similarly, we categorized products as “Amazon Brands” and exclusives if they are organic and is_amazon, and “Competing Brands” if the products are organic and not is_amazon.
We categorized organic products as entirely “Unaffiliated” if they did not meet the criteria for is_amazon, is_amazon_sold, and is_amazon_shipped. In other words, these are competing brands that are sold and shipped by third-party sellers.
The features and categories we identified are hierarchical and overlap. Their relationships are summarized in the diagram below.
Data Analysis
Ranking Analysis: Who Comes Out on Top?
We analyzed the rate of products that received the top search result relative to the proportion of products of the same category that appeared in our sample. We found that Amazon brands and exclusives were disproportionately given the number one search result relative to their small proportion among all products.
We used two straightforward measures for our analysis. First, we calculated a population metric using the percentage of products belonging to each category among products from all the search pages. To do this, we divided the number of products per category that occupy search result slots compared to all product slots in our sample. This included duplicates.
We then calculated an incidence rate for how frequently Amazon gave products in each category the coveted first spot in search results. We did this by dividing the number of searches in each category in the top spot by the total number of searches in our sample (with at least one product). (A table of each of these metrics by category appears in our GitHub and in “Supplementary datasets.”)
We chose to focus on that top left spot because Amazon changes the number of items across the first row based on screen size, and some searches return only a single item per row, so the top left spot is the only one to remain the same across all search results in our data.
In a majority of the searches in our data, 59.7 percent, Amazon sold the top spot to a sponsored product (17.3 percent of all product slots). The bulk of our analysis concerns the remaining 40.3 percent.
When we looked at all searches, Amazon gave its own products the number one spot 19.5 percent of the time even though this category made up only 5.8 percent of products in our sample.
Amazon gave competing brands the number one spot at a nearly identical rate (20.8 percent of the time), but these cover more than 13 times the proportion of products in our sample (76.9 percent).
Amazon gave entirely unaffiliated products (competing brands that were sold and shipped by third-party sellers) the top spot 4.2 percent of the time, but these products made up 5.8 percent of all products in our sample.
The only organic (nonsponsored) category that Amazon placed in the number one spot at a rate that was greater than the proportion of its products in the sample was its own brands and exclusives.
About eight in 10 (83.9 percent) of the Amazon brands or exclusives that Amazon placed in the top spot were labeled “featured from our brands.” These are identified as part of Amazon’s “search results” and are not marked “sponsored.” However, the source code for those labeled results contained information that was the same as sponsored product listings (data-component-type=”sp-sponsored-result”). These Amazon brand and exclusive brand products were not labeled as “sponsored” for shoppers.
Where Are Products Placed?
In addition to the top spot, we calculated how often Amazon placed each type of product in each search result position down the page (1–60). All searches have a number one spot but do not always return 60 results, so we always calculated this rate using the number of searches with that product spot as the denominator. Sponsored results that are part of search results are counted in the denominator of the rates.
(As mentioned earlier, we did not include promotional and advertising carousels and modules because these are not part of the grid labeled “search results” in the metadata and none appeared in the same place in a majority of search results.)
Amazon placed its own products and exclusives in the number one spot 3.5 times more frequently than in any other position on the search page.
It placed competing brands (including those it sells itself) everywhere except the top (1) and bottom (15) rows of the search page. Competing brands appeared only sparsely where sponsored products were common in search results (rows 4–5 and 8–9). The company placed entirely unaffiliated products—meaning a competitor’s brand that was both sold and shipped by a third party—primarily in the lower rows (9–13).
In 59.7 percent of searches in our sample, Amazon gave the number one spot to sponsored products. When Amazon returned a 15th row, it always listed sponsored products there, too.
Not Always Labeled
Amazon only identified 42 percent of its brands and exclusives to the shopper with a disclosure label (e.g., “featured from our brands,” “Amazon brand,” or “Amazon exclusive”). Of the Amazon brand and exclusive products in our sample, 28.8 percent were from a brand many people (but not all) would understand to be a private Amazon label, such as “Whole Foods,” “Amazon Basics,” or “Amazon Essentials.” Some were both labeled and from a better-known Amazon brand. For the remaining 37.4 percent, we found that buyers were not informed that they would be purchasing an Amazon brand or exclusive.
When the same product that is an Amazon brand or exclusive appeared more than once in the same search, we considered it labeled if any of the listings were labeled. This gives Amazon the benefit of the doubt by assuming that a customer will understand that the disclaimer applies to duplicate listings. Therefore, our metrics for disclosure are the lower bound.
Duplicates
Amazon gave its own products more than one spot in search results in roughly one in 10 (9.2 percent of) searches, not including other potential duplicates in promotional carousels. It did not give competing brands’ products more than one spot for organic search results.
Survey Results
We commissioned the market research group YouGov to conduct a nationally representative survey of 1,000 U.S. adults on the internet, to contextualize our findings. It revealed that 76 percent of respondents correctly identified Amazon Basics as being owned by Amazon and 51 percent correctly identified Whole Foods.
The vast majority of respondents, however, could not identify the company’s top-selling house brands that did not contain the words “Amazon” or “Whole Foods” in their name. Ninety percent did not recognize Solimo as an Amazon brand, and 89 percent did not know Goodthreads is owned by Amazon. Other top-selling brands, like Daily Ritual, Lark & Ro, and Pinzon were not recognized by 94 percent of respondents as Amazon brands.
We also asked respondents what trait defines the top-ranked products in Amazon search results. Few expected it to be based solely on being an Amazon brand. More than 21 percent of respondents thought the top-ranked product would be “the best seller,” 17 percent thought it was “the best rated,” 11 percent thought it was “the lowest price,” and 33 percent of respondents were “not sure.” Only 17 percent thought the number one listed item was “a product from one of Amazon’s brands.”
Quality and Sales Factors
We compared the star ratings (a rough proxy for quality) and number of reviews (a rough proxy for sales volume) of the Amazon Brands that the company placed in the number one spot on the product search results page with other products on the same page.
We found that in two-thirds (65.3 percent) of the instances where Amazon placed its own products before competitor brands, the products that were Amazon brands and exclusives had lower star ratings than competing brands placed lower in the search results. Half of the time (51.7 percent) that the company placed its own products first, these items had fewer reviews than competing products the company chose to place lower on the search results page.
One in four (28.0 percent of) top-placed Amazon brands had both lower star ratings and fewer reviews than products from competing brands on the same page.
When we evaluated several predictive models, we found that features like star ratings and the number of reviews were not the most predictive features among products Amazon placed in the number one spot.
Random Forest Analysis
We tried to determine which features differentiate the first organic product on search results from the second organic product on the same page.
To do this, we created a categorical dataset of product comparisons and used it to train and evaluate several random forest models.
The product comparisons looked at differences in features that we had access to, and that seemed relevant to product rankings (like stars and reviews). We found that being an Amazon brand or exclusive was by far the most important feature, of the seven we tested, in Amazon’s decision to place a product in the number one versus number two spot in product search results.
How We Created Product Comparisons
We took our original dataset of 3,492 search results with at least one Amazon brand or exclusive, filtered out sponsored products, and generated a dataset of product comparisons. Each product comparison is between the number one product and number two product on the same search page. The random forest used these attributes to predict a yes or no (boolean) category: which product among the pair was given the top search result (placed_higher).
The product comparisons encode the differences in star ratings (stars_delta) and number of reviews (reviews_delta); whether the product appeared among the top three clicked products from one million popular searches in 2020 from Amazon Seller Central (is_top_clicked); and whether the product was sold by Amazon (is_amazon_sold), shipped by Amazon (is_amazon_shipped), or was an Amazon brand or exclusive (is_amazon). We also used a randomly generated number as a control (random_noise). Distributions of each of these features is available on GitHub.
While we had access to price information, we did not analyze its potential effect on ranking because price was not standardized per unit. We also had access to each product’s “best sellers rank” for the time period we collected product pages, but the same product could have various different rankings in different Amazon categories (e.g., #214 in Beauty & Personal Care and #3 in Bath Salts), making consistent comparisons impossible.
This produced a dataset of 1,415 product comparisons. (To see exactly how we created our training and validation dataset, see our GitHub.)
By creating this dataset of product comparisons, we were able to compare two products with one model and control for which features led to higher placement.
Why Random Forest?
A random forest combines many decision tree models, a technique we used in a previous Markup investigation into Allstate’s price increases. Decision trees work well at predicting categories with mixed data types, like those from our product comparisons.
Decision trees can, however, memorize or “overfit” the training data. When this happens, models can’t make good predictions on new data. Random forests are robust against overfitting and work by training a forest full of decision trees with random subsets of the data. The forest makes predictions by having each tree vote.
We used grid search with five-fold cross-validation to determine optimal hyperparameters (parameters we control versus those that arise from learning cycles): 500 decision trees in each forest, and a maximum of three questions each decision tree can ask the data. By asking more questions, each tree becomes deeper. But that also means that the trees are more likely to memorize the data. The more trees we train, the more resources it takes to run our experiment. Grid search trains and evaluates models with an exhaustive list of combinations of these hyperparameters to determine the best configuration.
Evaluating the Models
Our model correctly picked Amazon’s number-one-ranked product 73.2 percent of the time when all seven features were considered.
We systematically removed each feature and retrained and reevaluated the model (called an ablation study) in order to isolate the importance of each individual feature. We used the accuracy of the model trained on all seven features as a baseline to compare each newly evaluated model (see results in Change of Accuracy in table above).
When we did this, we saw that removing information about whether a product was an Amazon brand or exclusive (is_amazon) reduced the model’s ability to pick the right product by 9.7 percentage points (to 63.5 percent). This drop in performance was far greater than any other individual feature, suggesting that being an Amazon brand or exclusive was the most predictive feature among those we tested in determining which products Amazon placed in the first organic spot of search results.
To demonstrate the influence of Amazon brands and exclusives in another way, we trained a model with only is_amazon, and it correctly predicted the number one product 70.7 percent of the time. Every other standalone feature performed significantly worse, only picking the correct product between 49.3 (random_noise) and 61.5 (is_sold_by_amazon) percent of the time.
To a lesser extent, the number of reviews (reviews_delta) were also predictive of a product getting the number one spot. Removing this feature reduced the model’s performance by 3.3 percentage points.
The other six features were less informative when it came to getting the number one spot versus the number two spot. Performance of the random forest for every possible permutation of features is available in our GitHub.
These findings were consistent with ranking the feature importance from the random forest model trained on all features. This third approach also suggests that is_amazon is the most predictive feature for the random forest.
When we compared additional product pairs with the number one spot and those of lower-ranked products beyond just the number two spot, is_amazon remained the most predictive feature out of those we tested (results in our GitHub).
We used predictive models to show that being an Amazon brand or exclusive was the most influential feature among those we tested in determining which products Amazon chose to place at the top of search results.
Limitations
Search Data Limitations
The two datasets we created are small in comparison to the full catalog of products for sale on Amazon.com, for which there are no reliable estimates. However, we sought to examine searches and products that generate significant sales, not every product or every search.
We collected search data on desktop, so our analysis only applies to desktop searches. Amazon’s search results may differ on mobile, desktop, and the Amazon app.
Amazon’s search results can also vary by location. One example is the distance of the closest Whole Foods store and its inventory, which would affect any given person’s search for certain items. We collected the data using I.P. addresses in Washington, D.C., so our results are specific to that city.
And, according to an Amazon-authored report for IEEE Internet Computing, a journal published by a division of the Institute of Electrical and Electronics Engineers, Amazon personalizes offerings to buyers according to similar items they have already purchased or rated (called item-to-item collaborative filtering). Our searches were not made in the same session nor were we logged into an Amazon account with user history, so our results were not personalized. In the absence of personalization, Amazon defaults to “generally popular items.” This also means that we did not capture search results or product pages for Amazon Prime subscribers.
Product Page Data Limitations
Some products that compete with Amazon brand and exclusive products are sold by numerous sellers, including Amazon itself. A 2016 ProPublica investigation revealed that of a sample of 250 products, Amazon took the buy box for itself or gave it to vendors that paid for the “Fulfilled by Amazon” program in 75 percent of cases. The same year, researchers at Northeastern University tracked 1,000 best-selling products over six weeks and found that buy box winners changed for seven out of 10 products in their study.
For our main analysis, we did not seek to analyze which specific seller won the buy box but rather whether the seller or shipper during our snapshot was Amazon or a third party.
We captured product pages and their subsequent buy boxes in a snapshot of time between Feb. 3–6 and 17–18. Due to a technical problem, there was a two- to four-week delay between when we collected the searches and when we collected the product pages. This means that the seller and shipper of those products are only representative of searches made during that time and could have changed from the time we collected the searches to when we collected the product pages.
When we collected product pages in February, about 3.9 percent of them were no longer available or the product had been removed from the Amazon Marketplace altogether since we gathered the search pages in January. We removed these products from any calculations involving the seller or shipper.
To test the reliability of our product page data, we took a random sample, on May 13, 2021, of 2,500 of the 125,769 products we had collected in February 2021 and reran the product page scraper.
Some of the product pages were missing data: 6.1 percent were sold out, 1.6 percent were removed from Amazon’s marketplace, and another 3.4 percent no longer displayed a default seller who won the buy box. In these latter cases, Amazon provided a button to “See All Buying Options.” The missing data did not overall favor or disfavor Amazon but rather was consistent with the proportion of Amazon-sold products (30.2 compared to 27.1 percent) from the sample of products we recollected.
The remaining 2,103 products that had legible buy boxes (the vast majority) were largely unchanged. Only 16.1 percent of products changed default sellers. This included changes between Amazon and third-party sellers.
Product sellers changed from a third party to Amazon in 1.6 ± 0.5 percent of products, and from Amazon to a third party in 3.1 ± 0.7 percent of products (margins of error calculated with 95 percent confidence).
When it came to who shipped the product, the shipper went from a third party to Amazon in 2.9 ± 0.7 percent of products, and from Amazon to a third party in 6.6 ± 1.1 percent of products.
Because the buy box remained largely unchanged during a 12-week gap in this representative subsample of our data, we find that our buy box findings are reliable, despite the three- to four-week gap between when we gathered search results and product pages.
This seemed to signal a change from previous research. So we went further to determine whether the buy box had become more stable since the 2016 Northeastern University study. That study was limited to products with multiple sellers. When we did the same, it brought the sample size down to 1,209. Looking only at products with multiple sellers, we found Amazon changed the buy box seller for only 23.5 percent of products. In addition, among products with multiple sellers, Amazon gave itself the buy box for 40.0 percent of them.
For products with multiple sellers, the winning sellers changed from Amazon to a third party in 2.1 ± 0.8 percent of products and from a third party to Amazon in 4.4 ± 1.1 percent of products. Third-party sellers changed among themselves in 31.4 percent of products sold by third-party sellers. No individual third-party seller won more than 0.06 percent of the products with more than one seller.
Shippers changed from Amazon to a third-party in 2.3 ± 0.8 percent of products and from a third party to Amazon in 7.8 ± 1.5 percent of products.
Reviewing the product pages three months apart, we found that the default seller Amazon chose for the buy box when multiple merchants were available has become significantly less likely to change from five years ago.
Limitations Identifying Amazon Brands and Exclusive Products
Amazon’s “our brands” filter is incomplete. For instance, it listed only 70.3 percent of products that were tagged “featured from our brands” on the search page. In addition, Amazon did not include its proprietary electronics in the “our brands” filtered results when we gathered the data. The company declined to answer questions about why these were not included.
Because of this, we had to use three methods to collect our product database of Amazon brands and exclusives, and it’s possible we missed some products, particularly proprietary electronics.
Black Box Audit
Our investigation is a black box audit. We do not have access to Amazon’s source code or the data that powers Amazon’s search engine. There are likely factors Amazon uses in its ranking algorithm to which we do not have access, including return rates, click-through rates, and sales. We have some data from Amazon’s Seller Central hub about popular products and clicks, but this data is itself limited and did not cover all of the products in our searches.
For these reasons, our investigation focuses on available and clear metrics: how high categories of products are placed compared to their proportion of results, how well users review highly ranked products relative to other products, and how many reviews a product has garnered, which is a crude indication of sales.
Amazon’s Response
Amazon did not take issue with our analysis or data collection and declined to answer dozens of specific questions.
In a short, prepared statement sent via email, spokesperson Nell Rona said that the company considers “featured from our brands” listings as “merchandising placements,” and as such, the company does not consider them “search results.” Rona said these listings are not advertisements, which by law would need to be disclosed to shoppers. We found these listings were identified as “sponsored” in the source code and also part of a grid marked “search results” in the source code.
“We do not favor our store brand products through search,” Rona wrote.
“These merchandising placements are optimized for a customer’s experience and are shown based on a variety of signals,” Rona said. None of these were explained beyond “relevance to the customer’s shopping query.”
Regarding disclosing to customers about Amazon brands, Rona said they are identified as “Amazon brand” on the products page, and some carry that wording in the listing. We found this to be the case in only 23 percent of products that were Amazon-owned brands.
She said brands that are exclusive to Amazon would not carry that wording since they are not owned by Amazon.
Rona supplied a link to an Amazon blog post that mentions that its branded products made up about one percent of sales volume for physical goods and $3 billion of sales revenue in 2019. It is unclear whether brands exclusive to Amazon are included in those figures.
Conclusion
Our investigation revealed that Amazon gives its own products preference in the number one spot in search results even when competitors have more reviews and better star ratings. We also found that reviews and ratings were significantly less predictive of whether a product would get the number one spot than being an Amazon brand or exclusive.
In addition, we found that Amazon placed its own products and exclusives in the top spot in higher proportion than it appeared in the sample, a preference that did not exist for any other category. In fact, it placed its own brands and exclusives in the top spot as often as competing brands—about 20 percent of the time—although the former made up only six percent of the sample and the latter 77 percent.
Almost four in 10 products that we identified as Amazon brands and exclusives in our sample were neither clearly labeled as an Amazon brand nor carried a name that most people recognize as an Amazon-owned brand, such as Whole Foods. In our survey, almost nine-in-10 U.S. adults did not recognize five of Amazon’s largest brands.
We also found that the default seller among products with multiple merchants changed for just three in 10 products over three months, a significantly lower rate of change than a similar study found five years ago.
Amazon’s dominance in online sales—40 percent in the United States—means the effect of giving its own products preference on the search results page is potentially massive, both for its own business as well as the small businesses that seek to earn a living on its platform.
Appendix
Supplementary Search Dataset and Analysis
When first exploring this topic and before hitting on our top searches dataset, we had created a generic dataset that returned similar findings. We replaced it as the main dataset because our top searches dataset was closer to real searches made by users. We include it here as a secondary dataset.
Generic Searches
We created a search dataset from products listed in each of the 18 departments found on Amazon’s “Explore Our Brands” page.
Three annotators looked through 1,626 products listed on those pages and generated between one and three search queries a person might use if searching for that product. These were meant to represent generic searches for which we know Amazon brands are competing against others.
We generated 2,558 search terms. We randomly sampled 1,600 and collected these searches using the same method and during the same time period we used to collect top searches. A quarter of the search results (24 percent) did not contain Amazon Brands, so we discarded them, leaving 1,217 generic searches, our supplementary dataset.
Generic Search Findings
In the generic searches, Amazon Brands constituted a slightly larger percentage of the overall product sample (8.2) than our top searches database (5.8). The percentage of the time Amazon gave its own products the number one spot also increased, to roughly one in four of our generic searches from one in five for our top searches.
Competing brands constituted a similar proportion of products in both of our datasets. However, Amazon placed competing brands in the number one spot even less often (10.8) in these generic searches than it had for top searches (20.8).
Entirely unaffiliated products made up even less of the pool of products in our generic searches (3.0) than top searches (5.8), and Amazon also gave them the top spot even less frequently, 1.5 percent of the time compared to 4.2 percent for top searches.
The results from this additional dataset show a similar pattern to our main dataset, whereby Amazon prioritizes its own products at the top of search results.
Counting Carousels
As mentioned earlier, we did not include sponsored or promotional carousels in our analysis.
If we were to consider sponsored or promotional carousels, the percentage of organic products from top searches would drop from 87 to 68 percent. This also means that sponsored products would increase from 17 percent to 32 percent. There were a total of 49,686 products in these carousels.
Acknowledgements
We thank Christo Wilson of Northeastern University, Juozas “Joe” Kaziukėnas of Marketplace Pulse, Rebecca Goldin of Sense About Science and George Mason University, Kyunghyun Cho of New York University, and Michael Ekstrand of Boise State University for reviewing all or parts of our methodology. We also thank Brendan Nyhan of Dartmouth College for reviewing our survey design.
Many merchants sell the exact same item, including Amazon, which picks a winner–often itself
When you shop on Amazon for a widely available product—a pair of Crocs, say, or Greenies dog treats—Amazon will pick among the merchants that offer the item and give one of them the sale when you hit “Add to Cart” or “Buy Now.”
In e-commerce, this is called winning the buy box. Amazon said its “featured merchant algorithm” picks the winner, instantly weighing available sellers’ past performance, price, delivery speed, and other factors.
Researchers at Northeastern University studying price changes on Amazon found that the merchant that won the buy box—which Amazon calls its “featured offer”—changed for seven in 10 products over a six-week period in 2016.
Five years later, we found that’s no longer the case.
When The Markup compared snapshots of 1,200 popular products 12 weeks apart, we found that the buy box was much less dynamic. The seller changed for fewer than three in 10 products in our sample.
The products we analyzed all appeared on Amazon’s first search results page of popular searches, meaning they receive prominent exposure to customers. We collected the data from an I.P. address in Washington, D.C.
Among the competing sellers for commonly available goods is Amazon itself. And when Amazon gave itself the buy box on products that other merchants also sold, it remained the buy box seller 12 weeks later for 98 percent of those products.
Overall, Amazon dominated the buy box when multiple sellers were available. We found that Amazon chose itself as the winning merchant of the “featured offer” for about 40 percent of products, while the next highest seller got the buy box in just half of one percent of popular products in our sample.
It’s hard to say why Amazon is changing the buy box winner less frequently than five years ago, said Christo Wilson, an associate computer science professor and one of the Northeastern University researchers who completed the 2016 study.
“The negative take,” he said, would be that “the market is becoming less competitive or that it’s easier for an incumbent to just sort of squat and remain stable.”
Amazon spokesperson Nell Rona declined to answer questions for this story. During congressional inquiry Amazon officials said the company doesn’t favor itself in the buy box or consider its profits in that decision.
They did acknowledge, however, that whether a product could be delivered quickly for free to Prime members is a factor in picking the seller for the buy box. Merchants typically pay extra fees for Amazon’s shipping service—Fulfillment by Amazon—to get that designation.
We found that the merchant Amazon selected for the buy box for almost every product—nine-in-10 of them—used Amazon’s shipping service. When we checked again three months later, less than 8 percent of products had changed shippers from Amazon to a third-party or vice versa.
The European Commission announced an investigation last November into whether Amazon’s criteria for the buy box results in preferential treatment for Amazon’s retail offers or sellers that use Amazon’s shipping service, which the commission said would be an abuse of Amazon’s dominant market position under E.U. antitrust rules.
In a May 2021 lawsuit, the Washington, D.C., attorney general wrote that “Amazon’s selection methods for the Buy Box winner consider factors that further reinforce Amazon’s online retail sales market dominance,” such as whether the seller uses Fulfillment by Amazon. In a court filing, Amazon responded that the lawsuit “fails to allege essential elements of an antitrust claim and, in any event, the conduct it attacks has been held by courts to be procompetitive.” The suit is ongoing.
Wilson said automated pricing algorithms may be playing a role in what The Markup found. It may also be a broader shift on the marketplace away from sellers competing to sell the same product to sellers developing their own branded products that only they are allowed to sell.
That shifts the competition away from the buy box to the search rankings, he said.
The Markup also found that Amazon gave its house brands and exclusive products a leg up in search results, above competitors with higher star ratings and more reviews, which are an indication of sales. Wilson reviewed our methodology for this investigation.
It was while testing the accuracy of findings for our main investigation that we discovered the stability of the buy box. There was a two- to four-week delay between when The Markup gathered search results and product pages. We gathered a sub-sample of listings a second time 12 weeks later to examine the effects of the delay and found they were minuscule.
“I would have thought that given that these [are] identical products and given that they are competing with similar costs, that there would be a little bit more turnover,” said Florian Ederer, an associate professor of economics at the Yale School of Management.
Shoppers can click on a link that will allow them to see more offers for a product, in addition to the one featured in the buy box. But e-commerce experts say most don’t bother: They estimate that more than 80 percent of sales on Amazon go through the buy box.
“Amazon talks about its marketplace as though it were a market,” said Stacy Mitchell, co-director of the small business advocacy group Institute for Local Self-Reliance, which has been critical of Amazon’s size and effect on retail competition in the U.S.
“This is not a market,” she added. “This is an artificial environment that Amazon controls, and it’s set up certain parameters that lead to certain outcomes.”